A spot price chart tells you what the metal is doing. It does not tell you what a coin costs or what a dealer will pay for yours. Most beginner confusion comes from treating those as the same number.
This guide shows how to read the chart itself, from axes and timeframes to candlesticks, and then how to connect what you see to the price you will actually pay or receive when you buy or sell.
What a Spot Price Chart Actually Shows
A spot price is the going price for immediate delivery of one troy ounce of metal. Two details trip up beginners right away.
First, a troy ounce is 31.1035 grams, about 10% heavier than the 28.35-gram ounce on a kitchen scale. Charts quote prices per troy ounce.
Second, no single office sets “spot.” It emerges from continuous wholesale trading, closely linked to futures in New York and over-the-counter trading in London. Separately, the LBMA publishes benchmark prices through electronic auctions, twice each London business day for gold (10:30 a.m. and 3:00 p.m. London time) and once daily for silver. Charting sites usually show a live quote built from market feeds, so two sites can differ slightly depending on their data source, timing and whether they plot the bid, the ask or the midpoint.
Reading the Chart: Axes, Chart Types and Candlesticks
Axes and units
Price runs up the vertical axis and time runs along the horizontal axis. Before reading anything, check the currency label (most charts default to U.S. dollars) and whether the chart shows the price per ounce, per gram or per kilo.
Line charts vs. candlestick charts
A line chart connects closing prices and is the cleanest way to see long-term direction. A candlestick chart shows four prices for each period (open, high, low and close), which adds detail about how the price moved inside that period. Beginners can start with a line chart and switch to candlesticks when they want more detail.
Reading a candlestick
The body of a candlestick spans the open to the close. The thin lines above and below, called wicks, show the highest and lowest prices reached. Colors vary by platform: many show green when the price closed above its open, but some reverse this, so check the legend. A long wick means the price traveled to a level but did not hold it. A doji, where open and close are nearly equal, shows indecision during that period. It describes what happened. It does not by itself predict a reversal.
Set the Timeframe Before You Read the Price
Each candlestick or data point covers one period, such as five minutes, one day or one week. The same market can look calm on a five-year chart and chaotic on a one-day chart, so the timeframe you pick shapes what the chart seems to say.
Match it to your decision. If you are building a stack of coins over years, weekly or monthly charts show the trend that matters. If you are about to sell, check the daily chart and then get a live quote, because intraday movement on a chart is noise for most coin buyers. If you buy gradually when prices are choppy, our guide on dollar-cost averaging into gold and silver explains the approach.
Linear vs. logarithmic scale
On a linear scale, equal vertical distances represent equal dollar changes. On a log scale, equal distances represent equal percentage changes. This matters on long charts. A $500 rise from $500 to $1,000 is a 100% gain, while a $500 rise from $2,500 to $3,000 is 20%. A linear chart draws both at the same height, while a log chart shows the first as much larger. Switching the scale is a quick way to avoid being misled by the most recent move.
Buy or Sell Gold & Silver Coins with Confidence
Work with a trusted Las Vegas coin dealer offering fair pricing, honest appraisals, and expert guidance every step of the way.
Trends, Support and Resistance: Context, Not Buy Signals
An uptrend is a series of higher highs and higher lows. A downtrend is lower highs and lower lows. A sideways trend moves in a narrow range. These describe the past and help you see where the market has been.
Support and resistance are price zones where the market has repeatedly turned. Support is where falling prices have stopped before, and resistance is where rising prices have stalled. Treat them as zones rather than exact lines, and remember they can fail. A level that held ten times can break on the eleventh. They show where buyers and sellers have been active, but they are not rules for when to buy or sell. No chart pattern reliably predicts the next move, and this is educational information, not financial advice.
What actually moves gold and silver tends to be outside the chart: interest rates, the dollar, inflation expectations and central bank demand. A chart records the effect, not the cause.
From Spot Price to Your Price: Premiums, Melt Value and Dealer Quotes
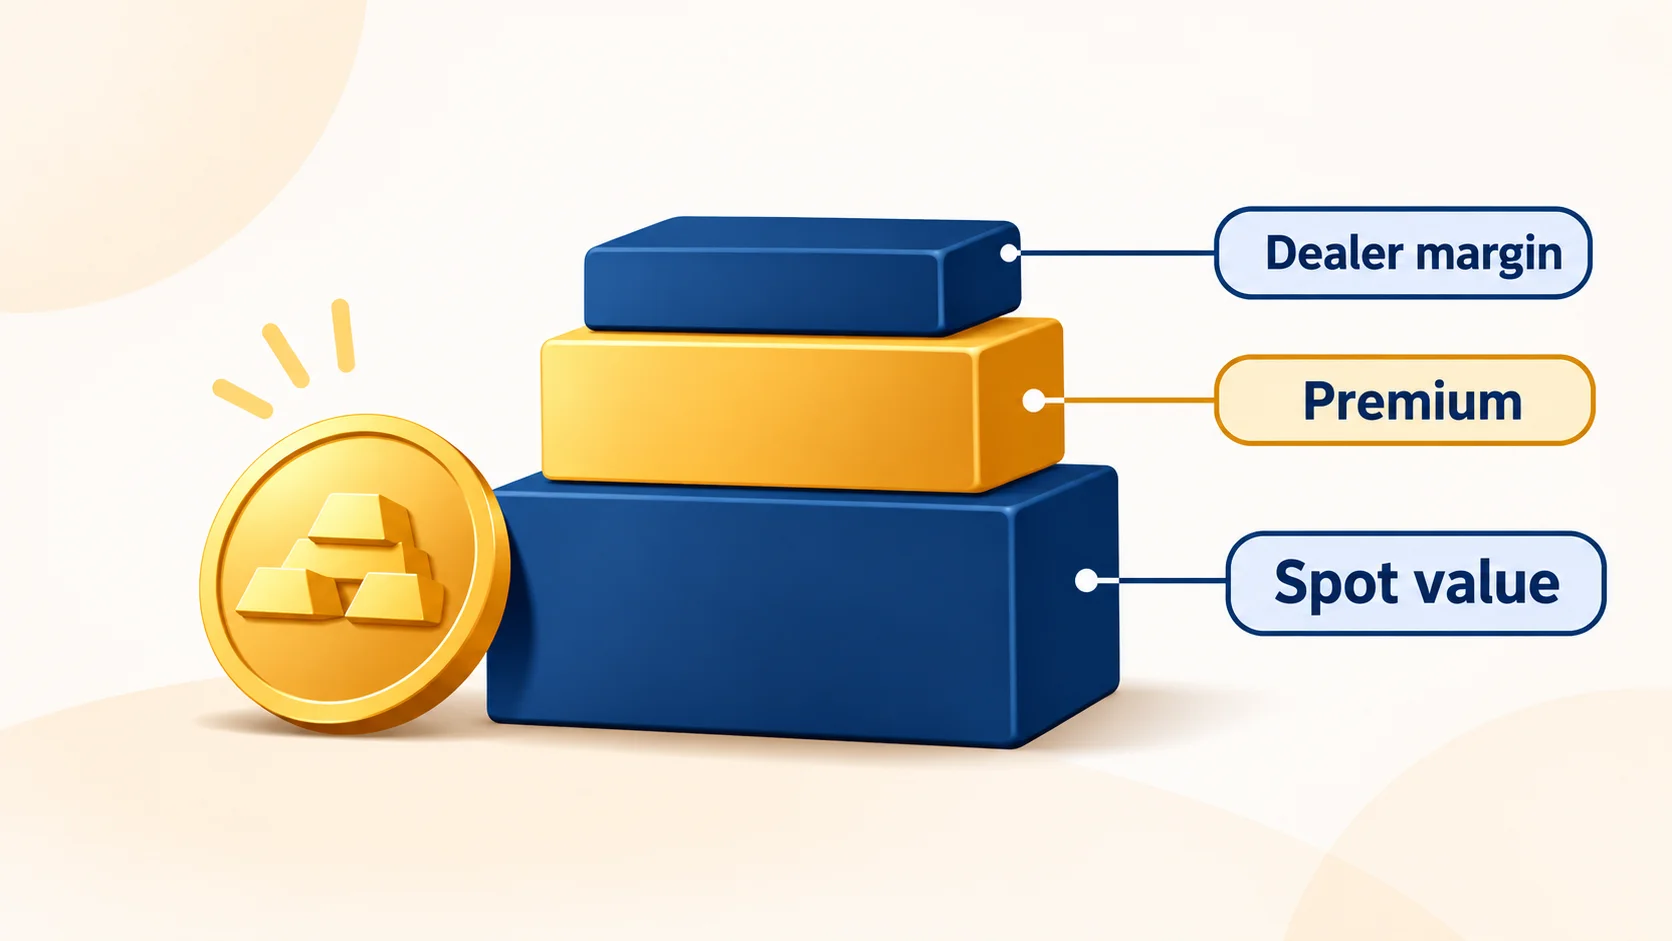
The chart shows the metal price. The price on a coin includes more.
- When you buy, the price is spot plus a premium covering minting, distribution and dealer margin. The premium varies by product, whether a one-ounce coin, a bar or a fractional coin, and by market conditions. Our guide to understanding bullion premiums explains the gap.
- When you sell, a dealer pays less than they sell for, because they must resell at a profit. Bids are often quoted relative to spot, and the spread varies by product.
- Melt value is the metal a coin contains multiplied by spot. It is a floor for many coins, not their full price.
Worked example (illustrative numbers, not current prices). Suppose spot silver reads $40.00 per ounce and spot gold reads $4,000.
- A one-ounce American Silver Eagle contains one troy ounce of silver, so its melt value is $40.00.
- $10 face value of pre-1965 90% silver coins contains about 7.234 troy ounces of silver (roughly 0.7234 ounces per $1 face). At $40.00 spot, melt value is about $289.36. Our junk silver melt value guide shows how to calculate it.
- A one-ounce American Gold Eagle contains exactly one troy ounce of gold, even though the coin itself weighs more (about 33.93 grams) because it is struck in an alloy. At $4,000 spot, its melt value is $4,000.
A dealer’s actual price will add or subtract from these numbers depending on whether you are buying or selling.
Where Spot Charts Stop Being Useful
Spot only governs bullion and melt value. A rare or collectible coin has a price driven by date, grade, rarity and collector demand, and it can move independently of the metal. Our article on numismatic premiums vs. bullion explains why.
Two other limits are worth knowing. Spot quotes typically pause over the weekend, so a chart can open with a gap on Monday. And a single metal’s chart does not show how gold and silver compare, which is what the gold-silver ratio is for.
Common Chart-Reading Mistakes
- Reading too short a timeframe. Minute-by-minute movement is rarely meaningful for coin buyers.
- Ignoring the currency or unit. A chart in euros per gram looks very different from dollars per ounce.
- Comparing prices from different sources without checking whether they are bid, ask or midpoint.
- Treating one candlestick or one level as a signal.
- Assuming spot is what you will pay or receive.
- Applying a metal chart to a rare coin, whose price depends on factors the chart does not show.
FAQ
1. What does “spot price” mean on a chart?
It is the current market price for immediate delivery of one troy ounce of the metal, usually quoted in U.S. dollars. It is a wholesale reference, not the price of a retail coin.
2. Is the spot price what I will pay for a coin?
No. Retail prices add a premium covering minting, distribution and dealer margin. When selling, dealers typically pay below what they charge.
3. Which chart type is best for beginners?
A simple line chart is easiest for seeing direction. Candlestick charts add detail about each period’s open, high, low and close, and are worth learning once you are comfortable.
4. What timeframe should I look at?
Match it to your decision. Weekly or monthly charts suit long-term holding. A daily chart plus a live quote suits checking before a sale. Very short timeframes are mostly noise for coin buyers.
5. Why do spot prices differ between websites?
Sites use different data feeds and may show the bid, the ask or the midpoint, and they may update at different intervals. Small differences are normal.
6. Can a chart predict where gold or silver is heading?
No chart reliably predicts future prices. Charts show where the market has been, and prices are driven by factors such as rates, the dollar, inflation expectations and demand.
Conclusion
Reading a spot price chart comes down to a few habits: check the unit and currency, choose a timeframe that fits your decision, use trend and support levels as context rather than signals, and remember that the chart shows the metal, not your coin. When you are ready to buy or sell, a live quote and an in-person look at your coins will tell you more than any chart. DEI GOLD AND SILVER COINS offers coin appraisals in Las Vegas if you would like to see what your pieces are worth today.
By DEI GOLD AND SILVER COINS | Articles by DEI GOLD AND SILVER COINS