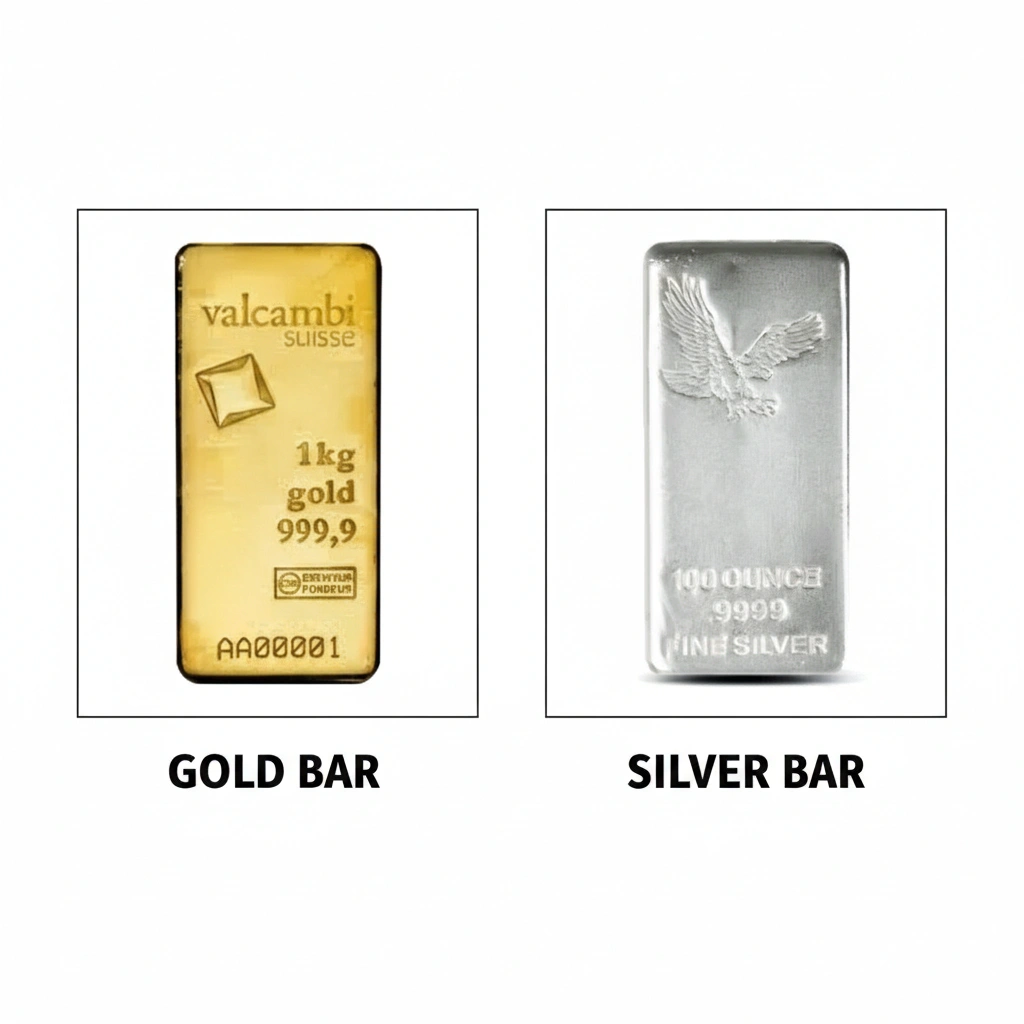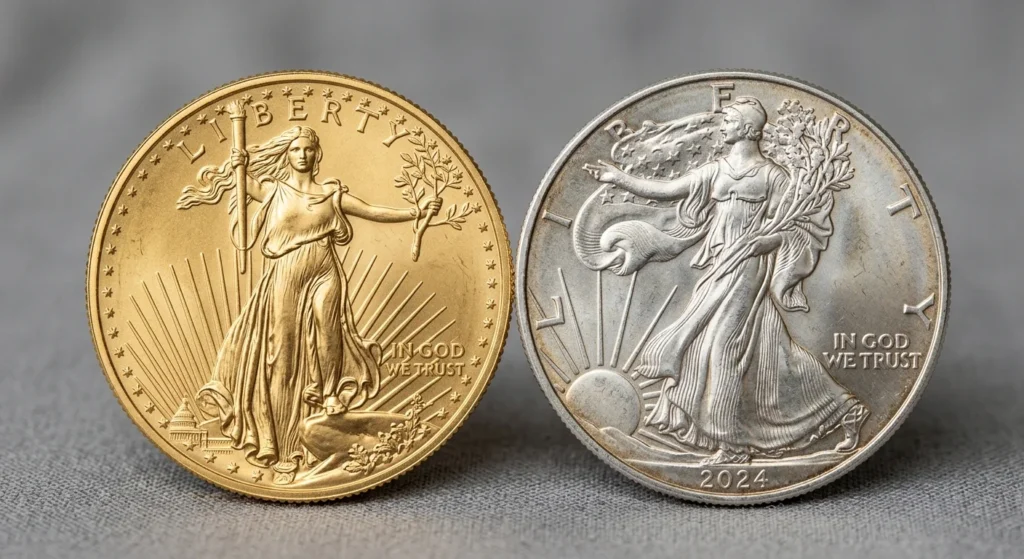
One ounce of gold costs about as much as several dozen ounces of silver. How many is the whole story of the gold-silver ratio, and that number has moved between about 15 and 125 over the last few centuries. This gold silver ratio explained guide covers what the figure measures, where the current gold to silver ratio sits, and why coin collectors should read it as context rather than as a signal.
It is a simple piece of arithmetic that carries a lot of history. American coinage law once fixed it by statute. Today the market sets it every minute. It also matters to anyone who owns a Morgan dollar, a pre-1933 gold coin, or a bullion round, because it shapes how the metal inside each one is valued.
What the Gold-Silver Ratio Actually Measures
The ratio is the price of one ounce of gold divided by the price of one ounce of silver. It tells you how many ounces of silver it takes to buy one ounce of gold.
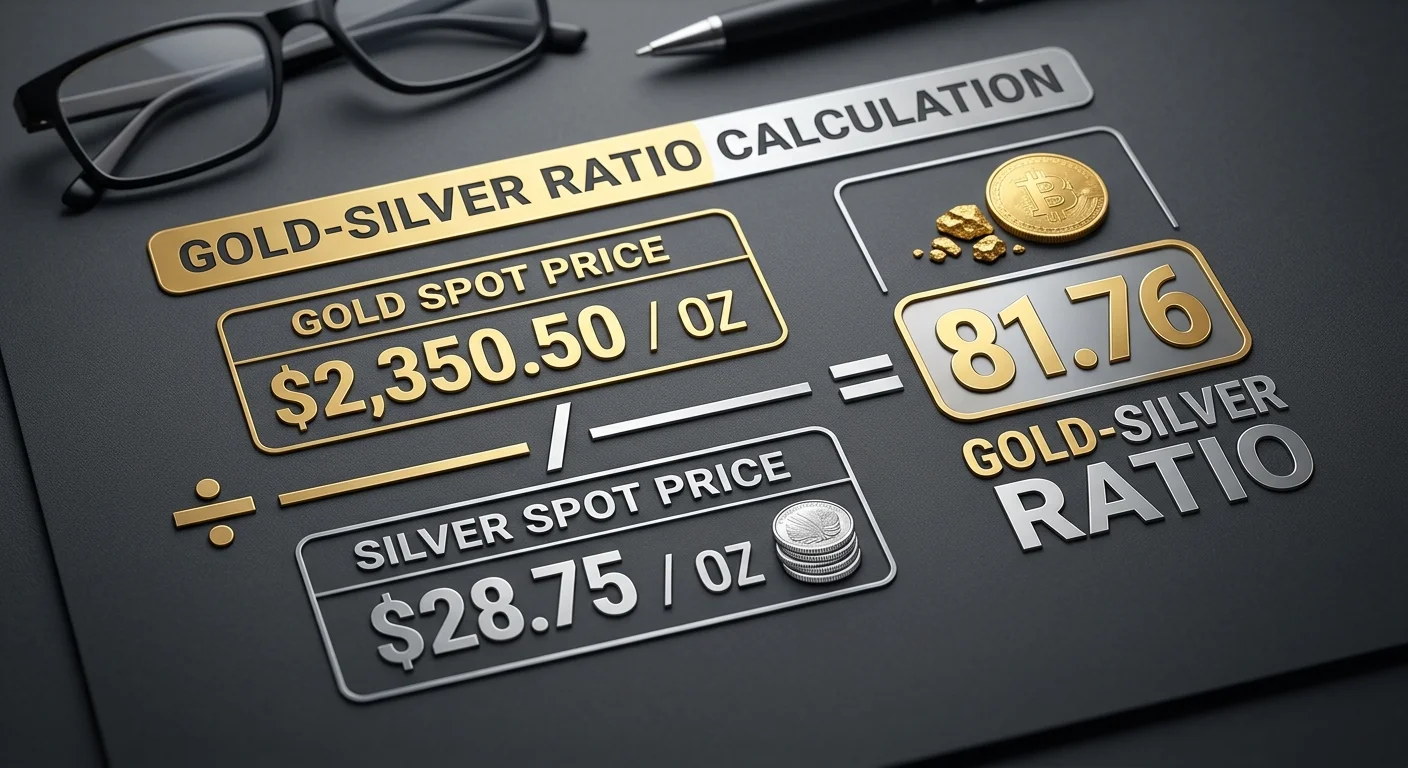
For example, if gold were priced at $4,000 per ounce and silver at $50 (round numbers used only to show the arithmetic, not current prices), the ratio would be 80. A higher number means silver is cheap relative to gold. A lower number means silver is relatively expensive.
The ratio does not tell you whether either metal is expensive in absolute terms. Gold and silver can both rise while the ratio falls, if silver rises faster. It is a comparison between two prices, nothing more.
The Current Gold to Silver Ratio
Market reports for the last week of September 2026 put the current gold to silver ratio at roughly 66.8 on September 25, and about 67.5 the day before. Earlier that week, it was near 65.7 on September 21. In other words, the ratio has recently been moving in the mid-to-high 60s.
Two things are worth noticing. First, day-to-day changes are usually small, but the ratio can swing meaningfully over weeks. One analysis found it moving from about 61.7 to 70.4 and back to 66.3 across twelve weeks between mid-June and early September 2026. Second, figures differ slightly by source and time of day, so a live chart on a bullion or market-data site is the right place to check before you act on any number. Treat the figures above as a late-September 2026 snapshot, not a standing value.
A Short History: From Fixed Mint Ratios to Free Markets
For most of American monetary history, the ratio was set by law.
The Coinage Act of 1792 built the U.S. Mint around a bimetallic system. It set the ratio of silver to gold at 15:1, and the Coinage Act of 1834 raised it to 16:1 by reducing the gold content of the coinage. A fixed ratio only works if it stays close to the market’s. When the two drifted apart, the undervalued metal tended to leave circulation, either exported or melted. That is why the 1834 change mattered to collectors: it helped keep gold coins in domestic circulation and pushed silver out, and gold coinage such as the Classic Head half eagle followed.
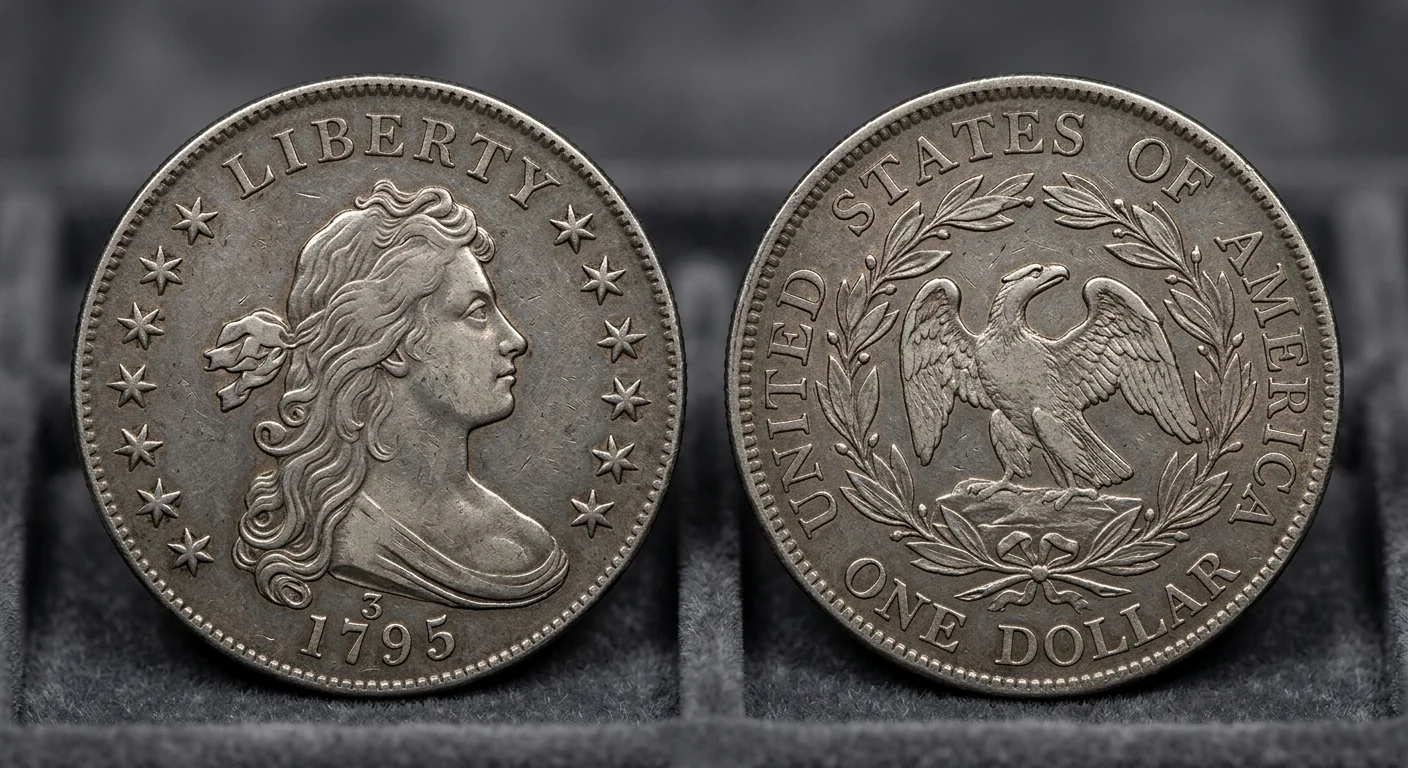
Later in the nineteenth century, silver’s place in the monetary system became a political fight. The Coinage Act of 1873 ended the standard silver dollar, and the Bland-Allison Act of 1878 brought silver dollar coinage back, which is the law behind the Morgan dollar. Collectors of that series are collecting a coin born from the argument over what silver was worth against gold.
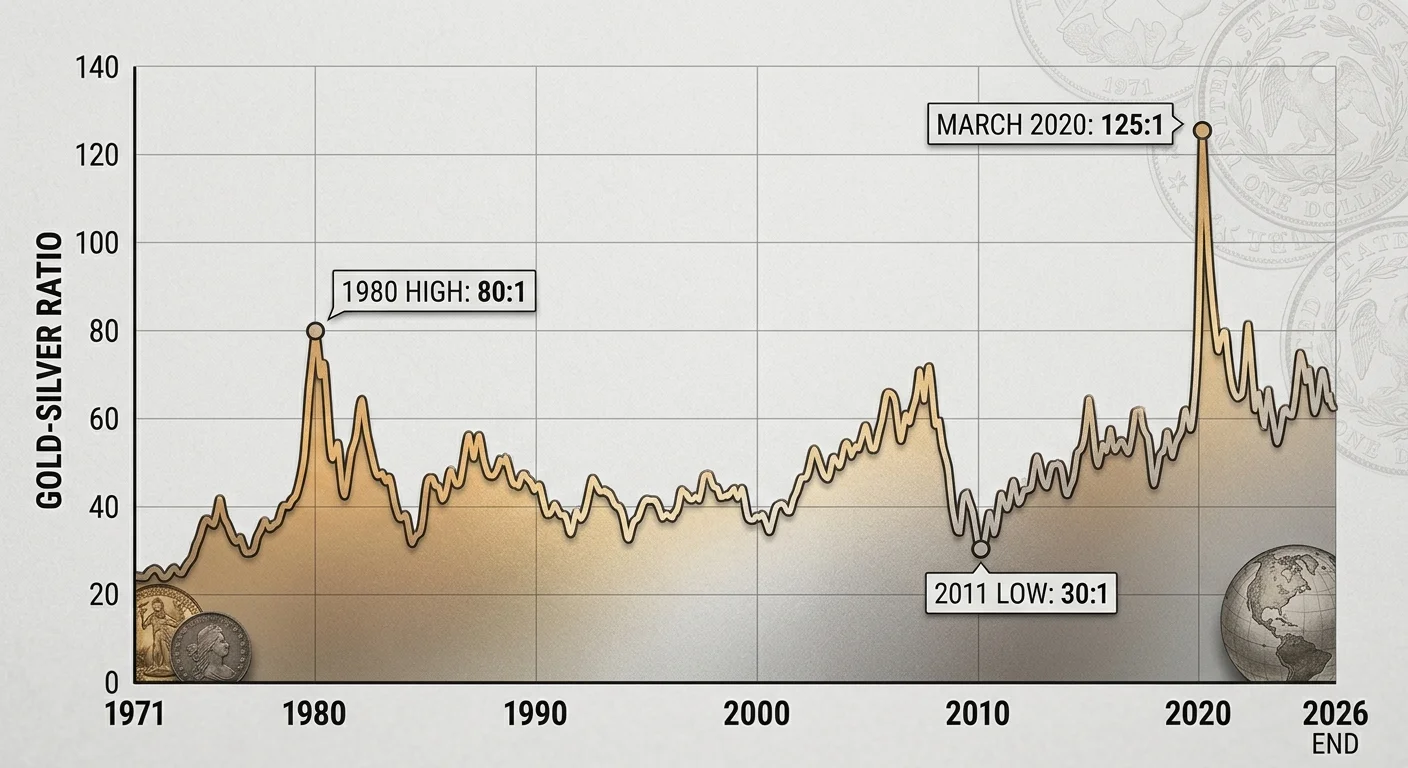
The modern era began in 1971. After the dollar’s link to gold was ended, both metals began floating freely. Since then the ratio has ranged from a modern low of about 17:1 in 1980 to a high of about 125:1 in March 2020. Three episodes explain most of that range:
- 1980: The Hunt brothers’ silver buying drove prices sharply higher before exchange rule changes stopped them, and silver collapsed. The ratio hit its modern low as silver briefly soared.
- 2011: Strong silver demand pushed the ratio down into the low 30s.
- March 2020: Pandemic lockdowns hit industrial silver demand while safe-haven buying supported gold, and the ratio spiked to a record.
Why the Ratio Moves
Gold and silver are related, but they are not the same market. Gold is held mainly as a monetary and reserve asset. Silver has a monetary side too, but it also carries significant industrial demand, in electronics and solar among other uses. It is also a much smaller market.
That smaller size explains why silver tends to move more sharply than gold in both directions. A firmer dollar or rising yields can hit silver harder than gold, widening the ratio. In a panic, investors run to gold first, and the ratio spikes. In an industrial or investor-driven boom, silver catches up and the ratio compresses.
Geology does not settle the question either. Silver is more abundant in the earth’s crust than gold, but the market ratio has run far above that natural proportion for most of modern history. Supply, demand, and investor behavior drive the price, not relative abundance alone.
What the Ratio Means for Collectors
Here the conversation changes, because a collectible coin is not just metal.
A gold or silver coin has a bullion value based on the precious metal it contains. Collectible coins often sell for more, and that difference is the numismatic premium, driven by rarity, condition, eye appeal, certification, provenance and collector demand. The ratio speaks only to the metal side.
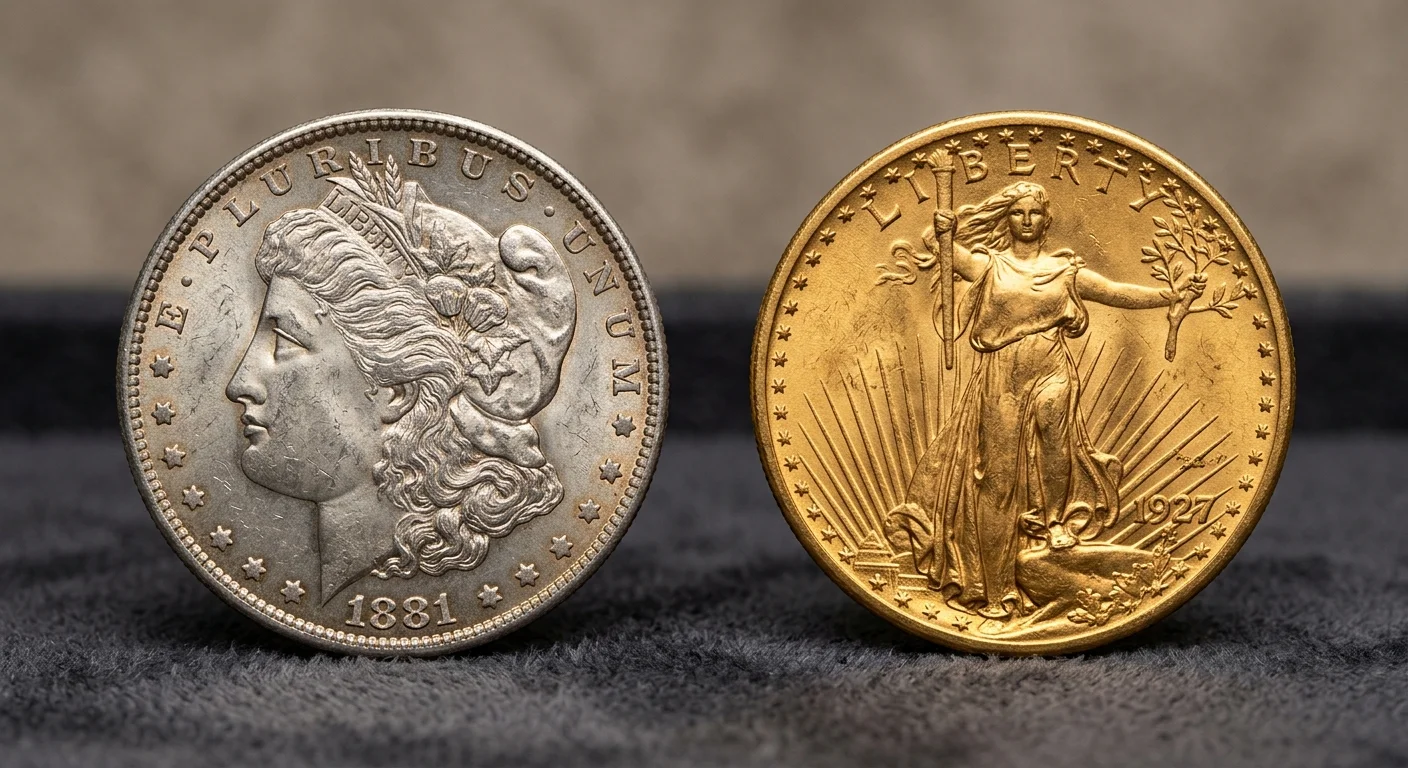
Consider two real coins. A Morgan dollar contains about 0.77 troy ounces of pure silver, and a Saint-Gaudens double eagle contains about 0.97 troy ounces of pure gold. When the ratio moves, the relative metal value of those coins moves with it. But a common-date Morgan in worn condition may trade close to its silver value, while a scarce date in high Mint State grade, certified by PCGS or NGC, can trade at many multiples of the metal. There, rarity and condition matter far more than the ratio. The reverse can happen too: some pieces are valued mostly for their metal, and a moving ratio matters more to them.
That is why melt value alone never determines what a collectible is worth. It sets a floor for some coins, not a price. DEI Gold and Silver Coins explains how the gap between metal price and selling price works in its guide to what you pay over spot when buying gold or silver. For a longer view on the metal side, the article on gold price history over 50 years puts recent prices in context.
A Hypothetical Example
This scenario is illustrative, not a real transaction.
Imagine a Las Vegas collector who owns a roll of common-date Morgan dollars and a single scarce-date Morgan. The collector notices the ratio has widened and wonders whether that changes the value of the collection.
For the common-date coins, the answer is partly yes. Their price follows silver, and silver’s move against gold is a factor. For the scarce coin, the answer is mostly no. Its value depends on what collectors will pay for that date, mintmark and grade. A change in the ratio does not make a rare coin rarer. It is the difference between metal value and numismatic value in a single afternoon.
Common Misreadings of the Ratio
A few cautions apply to anyone reading the number.
Rules of thumb are not predictions. Some investors watch levels such as 80 and 50 as informal signals for shifting between metals. One widely quoted rule suggests favoring silver when the ratio is above 80 and gold when it is below 50. That is a rule of thumb. The ratio can stay high or low for a long time, and it has sometimes gone further than people expected.
The average is not a target. The long-run average since 1971 depends on the period measured, and sources place it in the low-to-mid 60s. Being above or below the average does not tell you which way the ratio moves next.
One number does not describe your collection. If your holdings are mainly collectible coins, condition and rarity will matter more to their value than any ratio.
This article is educational and not investment advice. For decisions involving significant money, consider speaking with a qualified financial professional.
How DEI Gold and Silver Coins Looks at the Ratio
DEI Gold and Silver Coins is a Las Vegas coin dealer that buys, sells and appraises gold coins, silver coins, rare coins, bullion, paper money and fine jewelry. When evaluating a collection, the metal price is one input. The rest of the question is whether a piece is worth more as a coin than as metal, and that depends on date, grade, certification and demand. Its appraisal service is free and confidential, with no pressure to sell.
If you are new to accumulating silver, the silver stacking guide covers the basics. To see what is currently available, browse the silver dollars and pre-1933 U.S. gold coins pages. For appointments, call or text 702-460-5188.
Conclusion
The gold-silver ratio is a useful piece of context. It shows how the two metals are priced against each other, it has a long and colorful history, and it has moved through a wide range since 1971. At this moment, it sits in the mid-to-high 60s, and by the time you read this it will have moved again.
For collectors, the practical lesson is to separate two questions. What is the metal in a coin worth? And what would a collector pay for the coin itself? The ratio helps answer the first. Rarity, condition and demand answer the second, and for many collectible coins that is the question that matters.
Comparing gold and silver coins side by side is easier in person, and Las Vegas collectors can do that at coin shows produced by CK Shows. Confirm dates and details with CK Shows before you go.
DEI Gold and Silver Coins is the official sponsor of these shows.
Held and produced by CK Shows, Las Vegas, NV.
IG @CKShows
By DEI Gold and Silver Coins | Articles by DEI Gold and Silver Coins