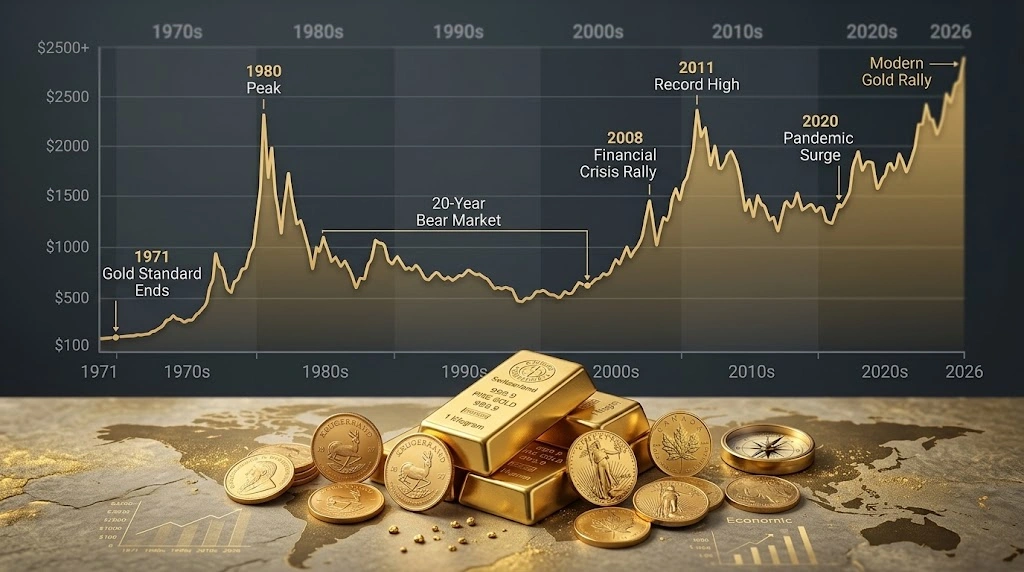
Every long bull run in gold eventually draws the same question: is this the top, or just another stop along the way? The honest answer starts with a look backward. A gold price history chart stretching back to 1971, when gold first began trading freely, shows the metal has moved through dramatic booms, decade-long slumps, and sharp corrections — and it has done this more than once. In this guide, you’ll walk through the major turning points of the last 50 years, see what actually triggered each move, and come away with a clearer sense of how historical gold price trends should (and shouldn’t) shape a buying or selling decision today.
Why the Gold Price History Chart Starts in 1971
Before 1971, gold’s price wasn’t really a market price at all. Under the Bretton Woods system established in 1944, the US dollar was pegged to gold at a fixed $35 per troy ounce, and foreign governments could exchange dollars for gold at that rate. Heavy government spending through the 1960s pushed far more dollars into circulation than US gold reserves could realistically back.
On August 15, 1971, President Nixon suspended dollar-to-gold convertibility, effectively ending Bretton Woods. For the first time in modern history, gold was allowed to float freely on the open market. Within two years, the price had roughly tripled. This single event is why almost every gold price history chart you’ll find starts its clock in 1971 — it’s the moment gold became a true market-driven asset instead of a fixed government rate.
The 1970s: Inflation and the First Gold Boom
The 1970s delivered nearly everything that tends to be good for gold at once: high inflation, two oil price shocks, and serious doubts about the US dollar. Gold climbed from roughly $65 an ounce in 1972 to well over $500 by late 1979.
The decade’s final act was its most dramatic. The Iranian hostage crisis and the Soviet invasion of Afghanistan, layered on top of US inflation running near 14%, sent investors rushing into gold as a safe haven. On January 21, 1980, gold hit an intraday peak of roughly $850 per ounce — a nominal record that would stand for the next 28 years.
1980–2000: The Gold Price History Chart’s Two-Decade Slump
What followed the 1980 peak is arguably the most important lesson in the entire gold price history chart: even a historic high can be followed by two full decades of decline. Federal Reserve Chairman Paul Volcker raised interest rates aggressively to crush inflation, which made non-yielding assets like gold far less attractive. At the same time, booming stock markets in the 1980s and 1990s gave investors better-performing places to put their money.
Gold drifted lower for most of the next 20 years, bottoming out around $253 an ounce in 1999 — a roughly 70% decline from the 1980 peak. Many investors wrote gold off entirely during this stretch, which, in hindsight, marked exactly the wrong time to give up on it.
2001–2011: The Bull Market Returns
Gold traded as low as about $256 an ounce in April 2001, the cheapest it had been in the 21st century. That changed quickly. The dot-com crash, the September 11 attacks, and mounting geopolitical uncertainty pushed investors back toward safe-haven assets, and central banks — net sellers of gold for most of the prior two decades — became net buyers again around 2009.
The 2008 global financial crisis accelerated the trend, and gold crossed $1,000 an ounce for the first time that year. The rally didn’t stop there. By September 2011, amid the European debt crisis and the first-ever downgrade of the US credit rating, gold hit a new all-time high of roughly $1,921 an ounce.
2011–2020: Correction, Consolidation, and a New Record
Records rarely go unchallenged, but they also don’t always hold. As global central banks pumped liquidity into markets and the US economy recovered, gold corrected sharply from its 2011 high, falling to around $1,050 an ounce by the end of 2015 — a drop of roughly 45%. For several years, gold traded in a relatively narrow range while equities climbed.
That changed with the COVID-19 pandemic. Unprecedented monetary stimulus and near-zero interest rates pushed gold to a fresh all-time high of about $2,067 an ounce in August 2020, finally surpassing the 2011 record.
2020–2026: Central Banks and the Modern Gold Rally
The current chapter of historical gold price trends has been driven less by retail investors and more by governments. Central banks bought gold at a record pace starting in 2022, led by China, Poland, and India, as part of a broader move to diversify away from the US dollar. Combined with ongoing geopolitical tension, that demand pushed gold through $4,000 an ounce for the first time in late 2025 and on to new all-time highs into early 2026.
Here’s a condensed view of the milestones covered so far:
Period | Approx. Gold Price | Key Driver | What Happened |
1971 | $35 → ~$44/oz | Nixon ends gold convertibility | Gold begins trading freely for the first time in decades |
Jan 1980 | $850/oz (intraday) | Inflation, Iran hostage crisis, Soviet-Afghan war | First major peak; record stood for 28 years |
1999 | ~$253/oz | Central bank selling, strong stock market | 20-year bear market bottom |
2008 | Crosses $1,000/oz | Global financial crisis | Central banks shift from net sellers to net buyers |
Sept 2011 | $1,921/oz | European debt crisis, US credit downgrade | New all-time high; record held for 9 years |
Dec 2015 | ~$1,050/oz | Rising real rates, strong dollar | 45% correction from the 2011 peak |
Aug 2020 | $2,067/oz | COVID-19 pandemic, near-zero rates | First close above $2,000/oz |
2024–2026 | $4,000 – $5,600+/oz | Record central bank buying, geopolitical risk | Successive all-time highs into early 2026 |
One useful distinction analysts make between this rally and the 2011 peak: the 2011 high was driven largely by investor sentiment and unwound quickly once crisis fears eased, while the 2022–2026 rally has been anchored by sustained sovereign buying — a different, arguably more durable kind of demand.
What 50 Years of Historical Gold Price Trends Teach Investors
A few patterns repeat clearly across the full gold price history chart:
- Gold tends to rise fastest during high inflation, financial crises, and geopolitical shocks — 1973-1980, 2008-2011, and 2020 all fit this pattern.
- Gold’s worst stretches have come from rising real interest rates and strong confidence in other assets, as seen through most of the 1980s and 1990s.
- Timing matters enormously. An investor who bought at the 1980 or 2011 peak waited years, sometimes decades, to see a new high in nominal terms.
- Corrections within a longer uptrend are normal, not necessarily a sign the trend is over — gold fell roughly 30% during 2008 before resuming its climb to new records.
None of this means gold always goes up, and it doesn’t mean every dip is a buying opportunity. It does mean that short-term price swings, in either direction, tend to look less dramatic once placed against 50 years of historical gold price trends.
Buy or Sell Gold & Silver Coins with Confidence
Work with a trusted Las Vegas coin dealer offering fair pricing, honest appraisals, and expert guidance every step of the way.
How to Use Gold Price History When You’re Buying or Selling Today
Long-term charts are genuinely useful, but they answer a different question than the one most sellers actually have, which is usually: what is this specific coin, bar, or piece of jewelry worth right now? For that, the historical chart is context, not a quote. The same logic applies whether you’re weighing a scrap gold vs. coins decision or pricing bullion — what matters day to day is the current spot price, the item’s exact weight and purity, and — for certified or rare coins — numismatic factors like grade and mintage that a chart alone can’t capture
A useful habit for anyone holding physical gold — including someone evaluating an inherited gold collection — is to check the current spot price before any appraisal, so you have a rough independent benchmark. From there, an experienced numismatist can walk you through how a specific offer was calculated relative to that day’s market, whether through a walk-in visit or a free coin appraisal in Las Vegas
Frequently Asked Questions
Gold was fixed at $35 per troy ounce under the Bretton Woods system from 1944 until August 1971, when President Nixon ended the dollar’s convertibility into gold. Before that, the price didn’t reflect open-market supply and demand the way it does today.
Aggressive interest rate hikes by the Federal Reserve under Paul Volcker made cash and bonds far more attractive than non-yielding gold, while booming 1980s and 1990s stock markets pulled investor attention elsewhere. Gold bottomed around $253 an ounce in 1999 before beginning its next major bull run.
Record central bank buying, led by countries like China, Poland, and India, combined with ongoing geopolitical tension, has been the primary driver. Unlike the 2011 peak, which was largely investor-sentiment driven, this rally has been supported by sustained government-level demand.
No. Gold has gone through multi-year and even multi-decade stretches of decline, most notably from 1980 to 1999. Historical gold price trends show strong long-term growth overall, but with real periods of stagnation or loss along the way, so timing and holding period both matter.
Long-term history provides context, but your actual offer is based on the current spot price, your item’s exact weight and purity, and any numismatic value from grading, rarity, or mintage. A knowledgeable dealer should be able to explain how today’s offer connects to today’s market, not just the historical chart.
Conclusion:
Fifty years of gold price history shows a metal capable of both spectacular rallies and long, patience-testing declines — often within the same decade. Understanding that pattern won’t tell you exactly where gold goes next, but it puts today’s headlines in useful perspective before you decide to buy, hold, or sell. DEI Gold and Silver Coins, backed by certifications from CAC, NGC, PCGS, GIA, and AGL and more than 50 years of combined numismatic experience, can help put current market conditions in context for your specific coins or bullion. Whichever way the market is moving, a clear, current valuation is the best starting point.